Data Model
The data model is where you describe your data so that DataStori — and your team — share a single, consistent understanding of it. Behind the scenes, the model is captured as an ontology YAML, which the AI Builder uses to generate transformations. You can work with the data model through an interactive UI or by editing the YAML directly.
A data model has three parts:
Tables & Columns
The list of tables, their columns, and descriptions is auto-generated from your data catalog. As soon as your data lands in the destination, DataStori populates the model with the available tables and columns so you have an accurate, up-to-date picture of your data without any manual setup.
Relationships
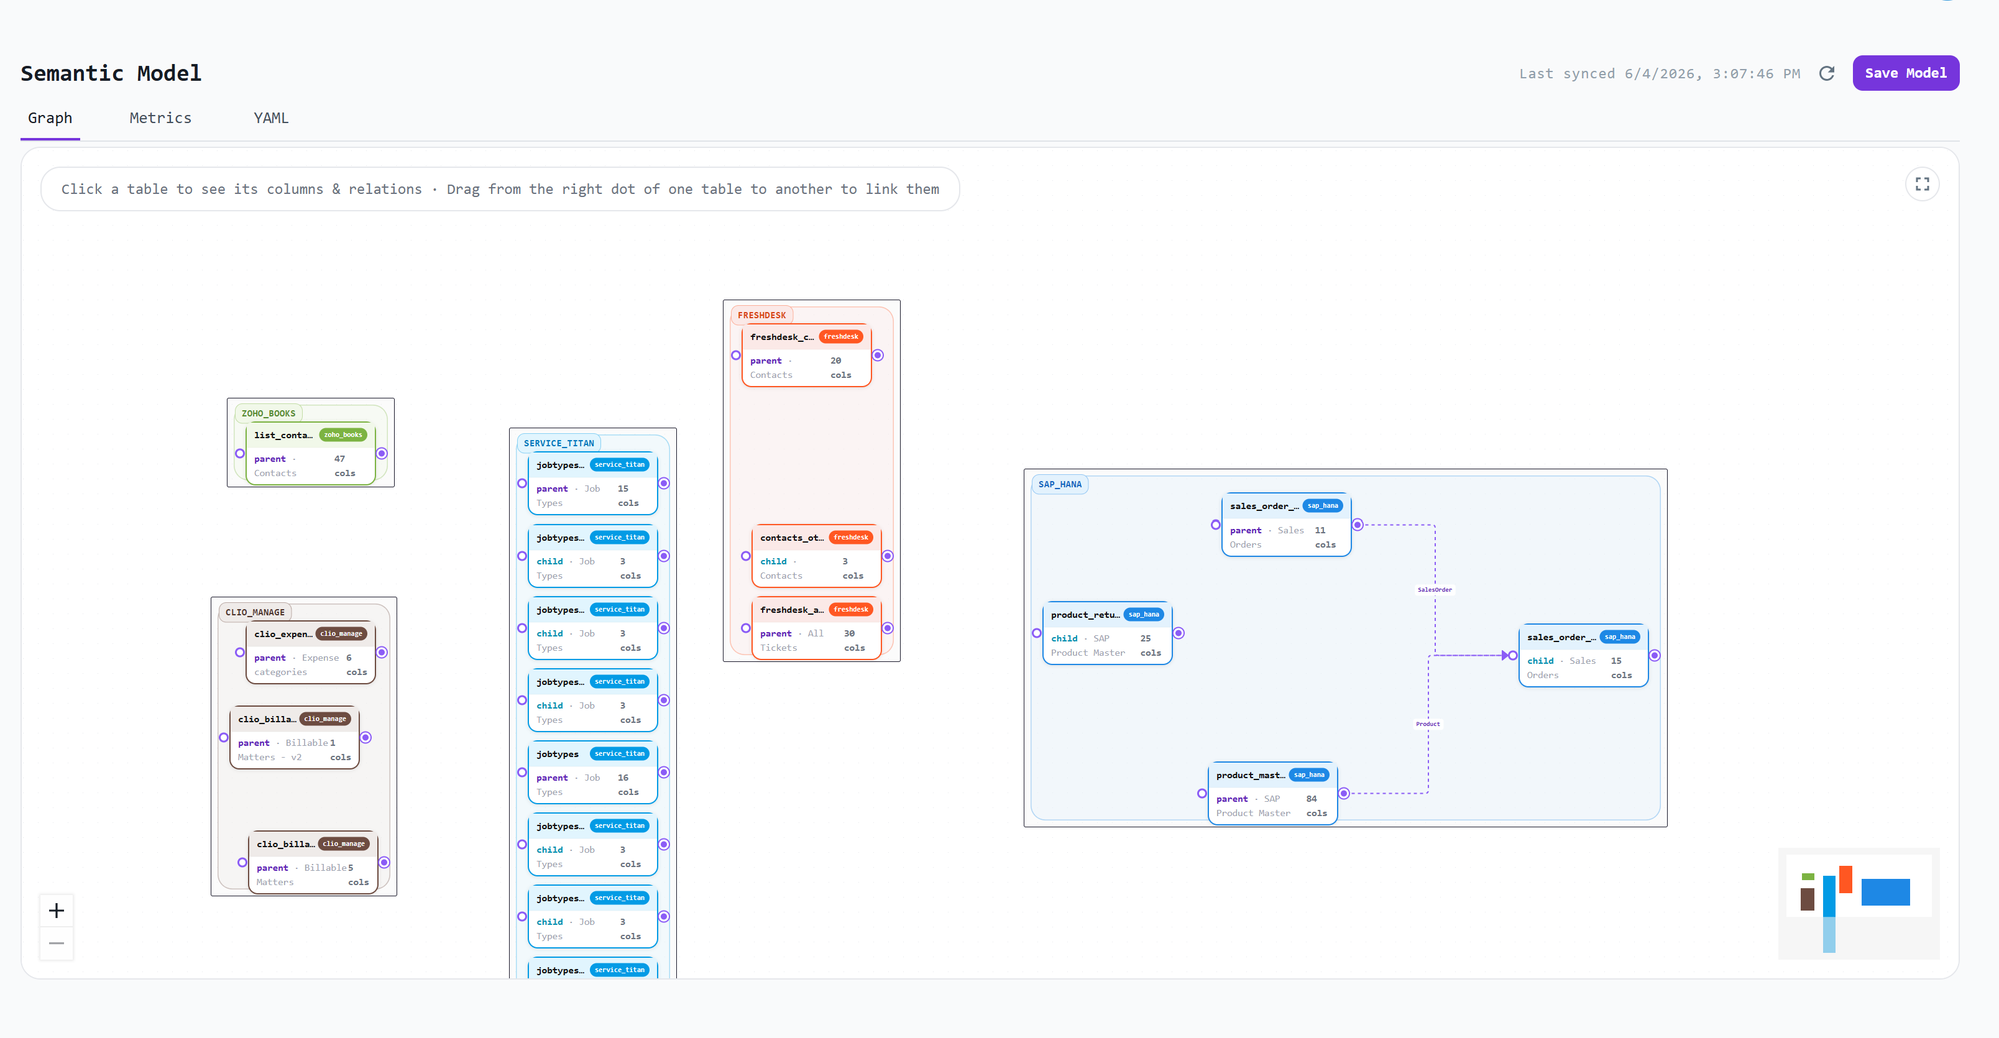
In the Graph view you define how your tables relate to one another. Click a table to inspect its columns and existing relations, then drag from the dot on one table to another to link them. These relationships tell the model how data across different sources and tables fits together.
Metrics
In the Metrics section you define the business metrics that sit on top of your tables and relationships — the measures your team reports on and analyzes. Defining them here keeps metric definitions consistent across every transformation and downstream use.
UI and YAML
The data model offers both a friendly UI and a YAML representation:
- Use the Graph and Metrics tabs to build and edit the model visually.
- Use the YAML tab to view or author the model as code.
Whichever way you build it, DataStori maintains the underlying ontology YAML that powers the AI Builder when it generates transformations.